
Traders spend the most time to find trading setups. But they also spend the most time on developing new methods to find better trading setups. It’s a little bit like chasing the holy grail.
Yes, I also spend a big portion of my time to find setups. But the methods stay the same. In the past I developed multiple ways to screen the market for interesting setups. Today I only seldom adjust the programming codes.
Do you have to be a programmer to find good setups? I don’t think so. Programming knowledge will help you and you should learn to program, but there are many other ways to discover great trading setups. I will show you 3 …
3 easy ways to discover great momentum trading setups
Here are some simple ways to look for great momentum trading setups. The methods are not complex or science and the tool I use is free!
Looking at biggest winners today/week/year

Momentum stocks have one in common: They are rising fast. So you can use the top gainer lists to look for setups.
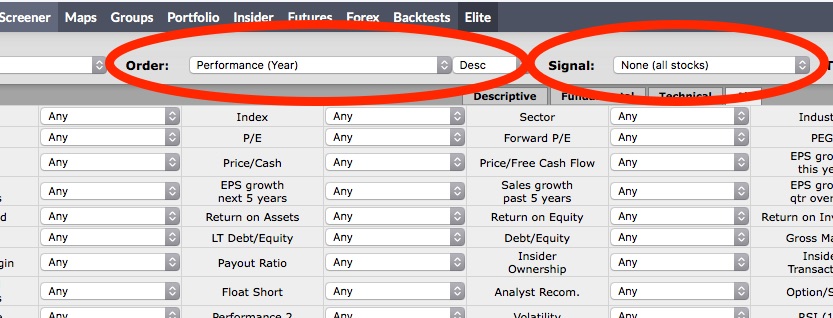
I mostly look at these criteria at Finviz:
- Stocks that moved more than 5% today. These are really strong movers and you maybe want to take some of them on your watchlist.
- 10% week winners: Here are stocks included that moved more than 10% a week. Mostly strong momentum moves starts with a strong move over a few days. I go trough all stocks in a Finviz chart gallery and maybe add some to my watchlists.
- Strongest stocks for 1 year: You will make the discovery that all the leading stocks are the most strong movers over 1 year. They always appear on the lists. Why? Because there is a great demand and they are making continuously new all-time highs.
Strongest mover from 52 week low

Another method I use is to look at the strongest movers from their 52 week low. The reason is simple: Good performing momentum stocks hold their acceleration. That means that the distance between the current price and the 52 week low will be the same or getting bigger.
In Finviz you can sort all stocks by their distance from the 52 week low. I normally use a minimum of 70%. That means all stocks should be at minimum 70% away from their 52 week low.
Unusual or high relative volume
I want to find stocks that not only show momentum but strong volume, too. My biggest winners all started with a huge volume. Sometimes 5 or 10 times the average volume.
Here are two ways to find strong volume movers:
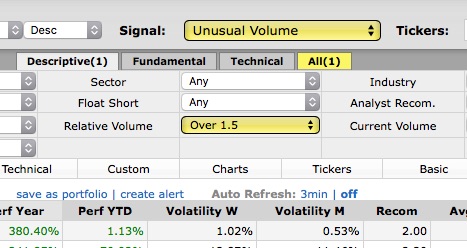
- Unsual volume: That is a signal filter in Finviz. It shows you all stocks where the volume is strongly above average. Sometimes here you can find interesting candidates for a watchlist.
- Strong relative volume: This is almost the same, but you can choose your own setting. I run a Finviz filter multiple times per trading session. For my filter I use the value 1.5, which means that I want to see only stocks with at least 1.5 above average volume.
Keep it simple to find good momentum setups
Yes, I run also more complex screeners. But they all come down to two things: Movement and volume. In all screeners I combine different filters. You can do it in Finviz, too.
I sometimes think about to give up my complex screeners and switch to the simpler ones. The more simple the better you can follow your routines.
The upper filters and screeners are good to start with. Especially for beginers. You must find a simple routine and follow it. If you did it for a while, you build up trust and you know what you are looking for.
Filters and screeners help you to focus more on price- and volume-behavior. They are not a trading system, they are just a tool to make the process easier for you.
Although I have multiple screeners running, I went through hundreds of charts per day! In a week I maybe see 2500 or more charts. Some of them I see every day. If I had no routine, screener or filter, I would not be able to do this.
Recommended books
Here is a small list of recommended trading books about this topic.
[amazon box=”0996307923″]
[amazon box=”0071807225,0071614133″]


 chart analysis – China eCommerce stock")
“begginers”
Love ur analysis….awesome….
Would be very happy I u would mentor me….any mentorship programme that you provide – love to be part of it…
Kindly let me know.
Thanks in Advance
I am a beginner
I enjoyed your approach to the way you will find winning stocks
I am interested to know if you have any setup to find stocks that are going through a pullback and move high soon.
Thank you