From the beginning of my trading career I was fascinated by fast moving stocks. Only a few times I tried to catch a bottom of a stock move. The other time I bought new 20 days, 52 week and all-time highs.
For a lot of people it goes against their beliefs to buy new highs. Why? Because the stock seems to be expensive in that moment. But the stock market works not like a supermarket. Cheap stocks are mostly not a bargain, they are rotten eggs.
The most persuading argument for me to buy a stock on a new all-time high is: What must a stock do if it should move up 10.000% in a row? Answer: It must take out old highs and reach new highs.
Example: Amazon – New highs are buying opportunities
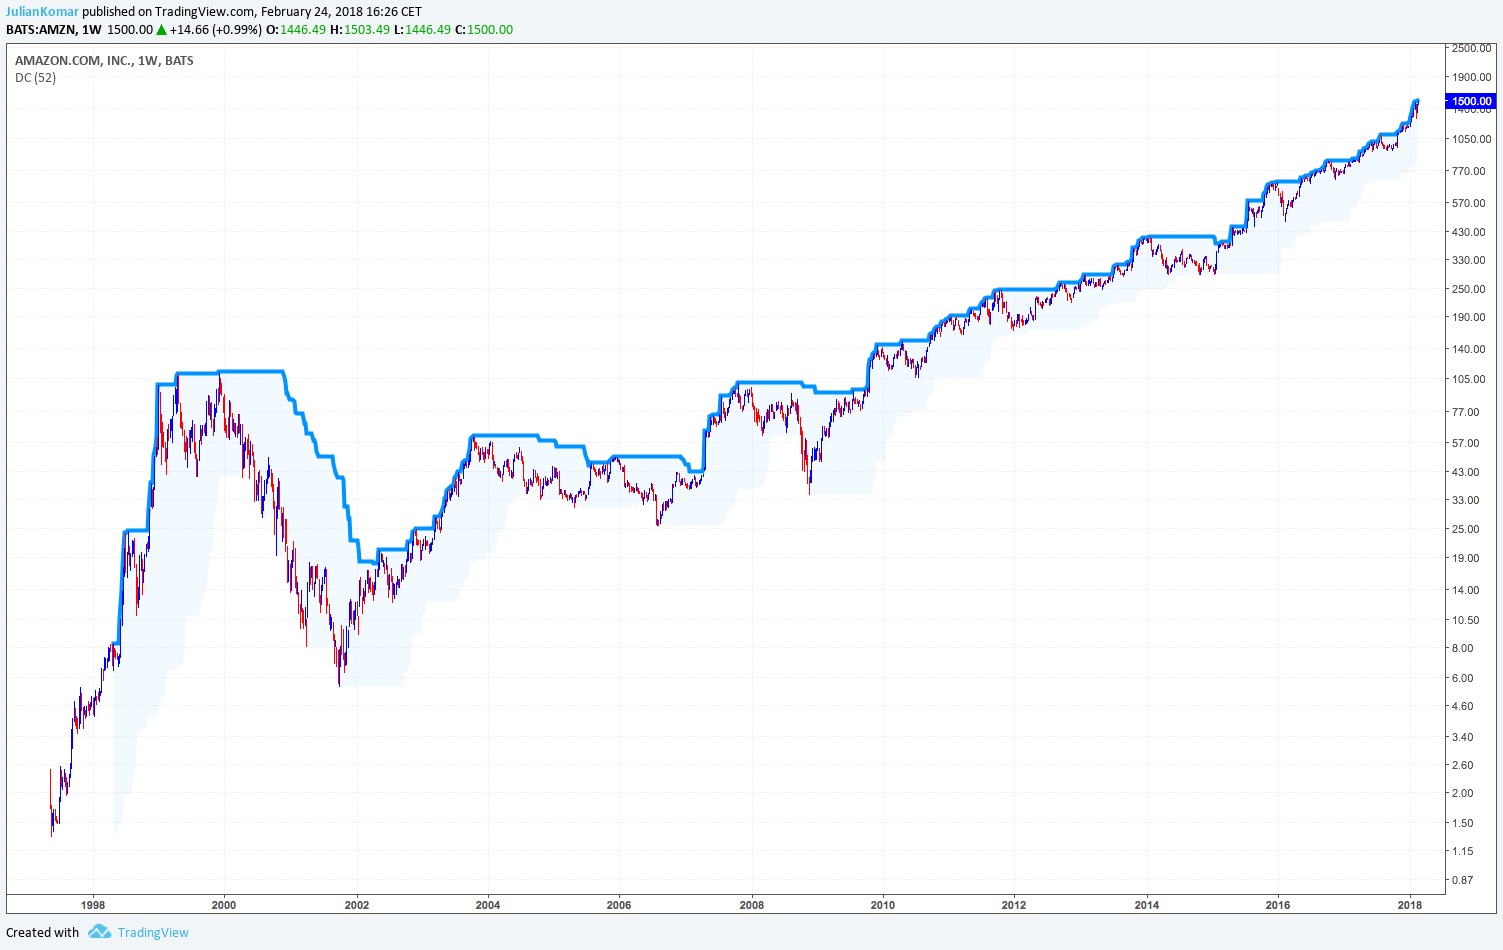
Amazon is one of the most successful stocks in the last years. I put a simple 52 week high line (with a Donchian Channel) on the chart. You can see clearly that every 52 week high was a buy opportunity.
Of course the stock had some seriously corrections, but that’s why you need a trading system with risk management and not only one indicator.
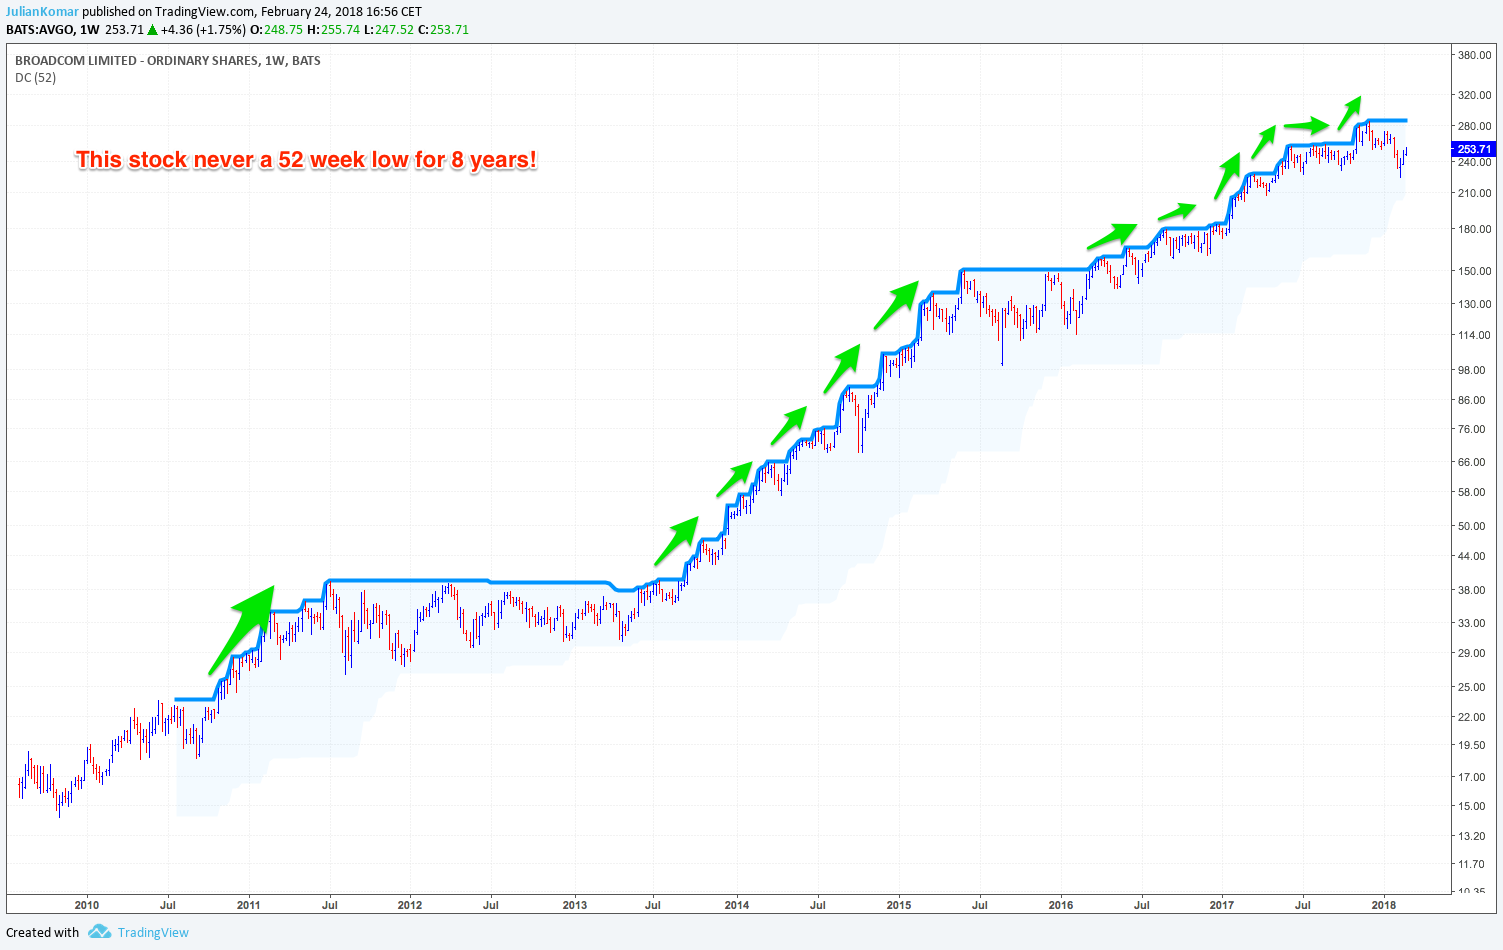
There are plenty of similar charts next to Amazon like Apple, Netflix, Nvdia and many more. All these super stocks have in common that they continuously reaching new 52 week highs and especially all-time highs.
The difference between a 52 week high and an all-time high: Overhead resistance
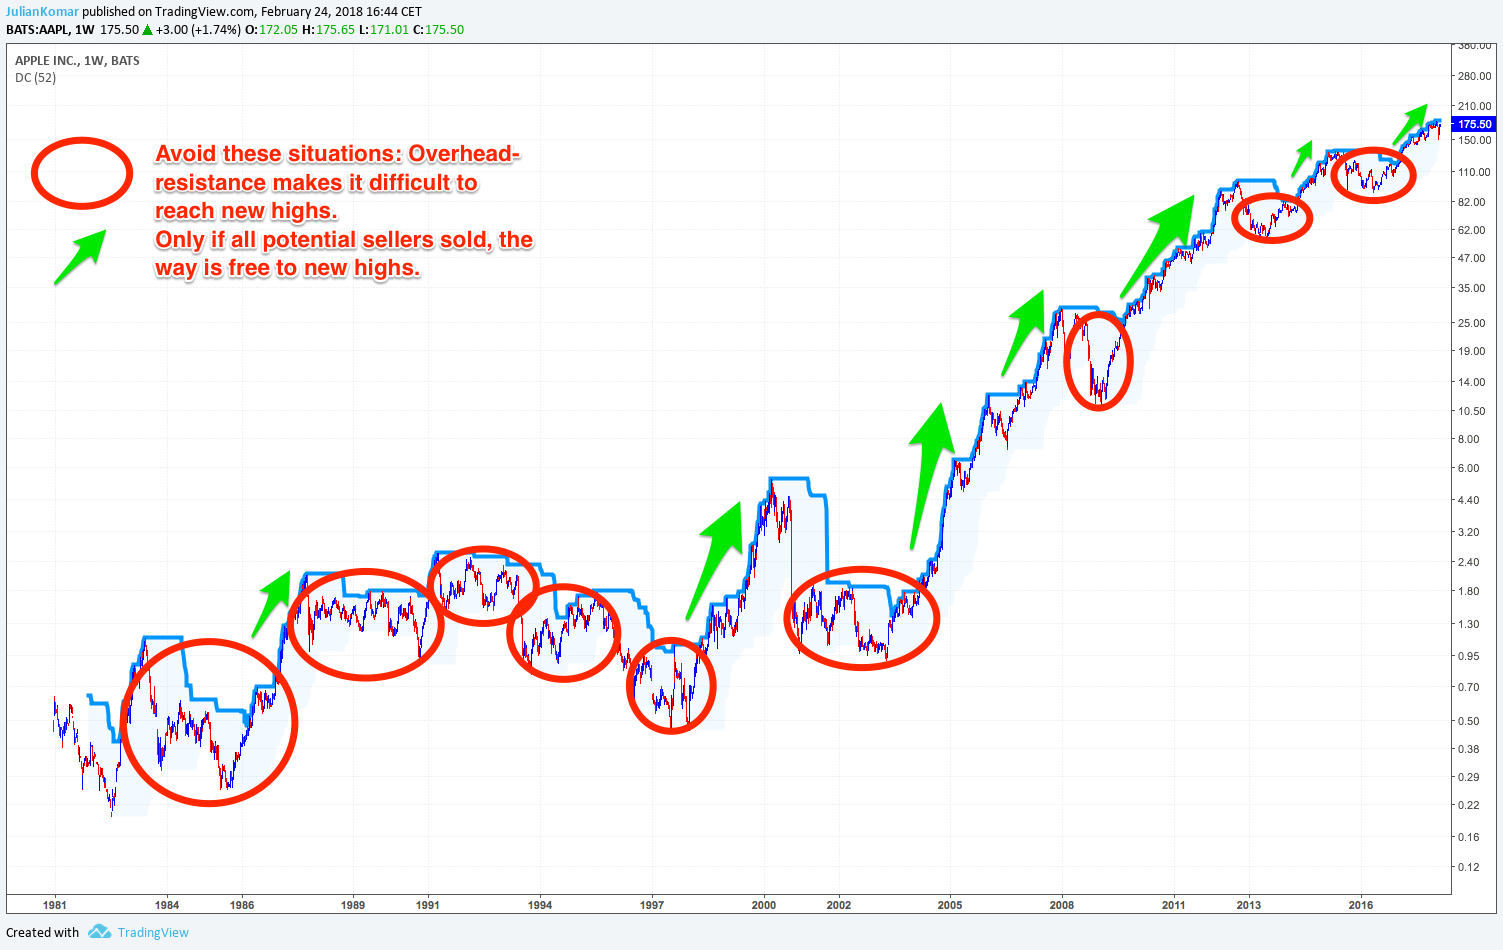
Not in all cases is there a difference between a 52 week high and an all-time high. Because if a stock is priced on an all-time high, it is automatically a 52 week high. The only difference is “overhead resistance“.
With overhead resistance I mean all potential seller that would sell a stock at higher prices. These traders had bought a stock at a higher price and now their trading positions show a loss. If the price returns now to a higher price they maybe close their position for break-even. The problem is that a seller is a seller and they are able to stop a price move.
If a stock is priced on an all-time high, the stock has “blue sky potential“. That means every trader has a position that shows a profit. No one is urged to sell because the trading position hurts.
But there are situations where the overhead resistance is absorbed by other traders. In these situations the stock quickly moves to new highs and afterwards maybe to new all-time highs.
All-time high trends lasting longer as you think

A stock with “blue sky potential” can trend longer as you think. If there is no serious selling pressure, the stock can move a long time until it hits resistance.
Stocks on new all-time highs have no technical resistance because there is no trading history. A trader cannot look back and search for important price barriers other similar. The only situation where an all-time high stock can reverse is if the bias in the stock changes. This normally takes a longer time and is caused by bad news.
You will see a change in an all-time high stock quickly. Normally it is gapping down or moves quickly to the downside. In that situation new overhead-resistance is created.
But if there is no bad news or anything similar, the stock can move much longer as you think.
Bull markets and new highs
Of course all upper examples are selected in hindsight. But normally bull markets produces a lot of similar examples.
It’s not possible to catch every superstock but you may ask yourself: Where do I want to fish?
- Do I want to fish in a sea with small, stinky fishes and where my odds are bad to fish a big one?
- Or do I want to fish in a sea where some really big fishes are swimming.
I prefer the last one.
So you can see that the important question is about the odds. That’s what stock selection is about. If you combine multiple criteria, the odds will increase and you maybe fish a really big fish out of the sea of stocks.
Should I trade in the weekly chart because of 52 week highs?
You can do it if weekly charts are your preferred time-frame. But it’s not necessary. I personally prefer the daily chart. And you should not blindly use a 52 week high as a trading signal.
The upper examples should give you an idea about stock selection. It’s much easier to trade a stock on a new all-time high. The selection is easier because the stocks are obviously visible, there is no overhead-resistance, often smooth trends emerge and the moves to the up-side are faster. That’s why I look for stocks on new all-time highs.
Recommended books
Here is a small list of recommended trading books about this topic.
[amazon box=”0071494715,0071614133,0071807225″]


 chart analysis – China eCommerce stock")